Understanding Defensive Play in Basketball
Player Statistics Lebron James, The Lakers
The purpose of this Informational Webpage is meant to give people insight on how to analyze and come up with simple conclusions on whether a basketball player has a good, bad, or even neutral defensive play skill. This Informational Webpage will use Lebron James playing for The Lakers as a prime example.
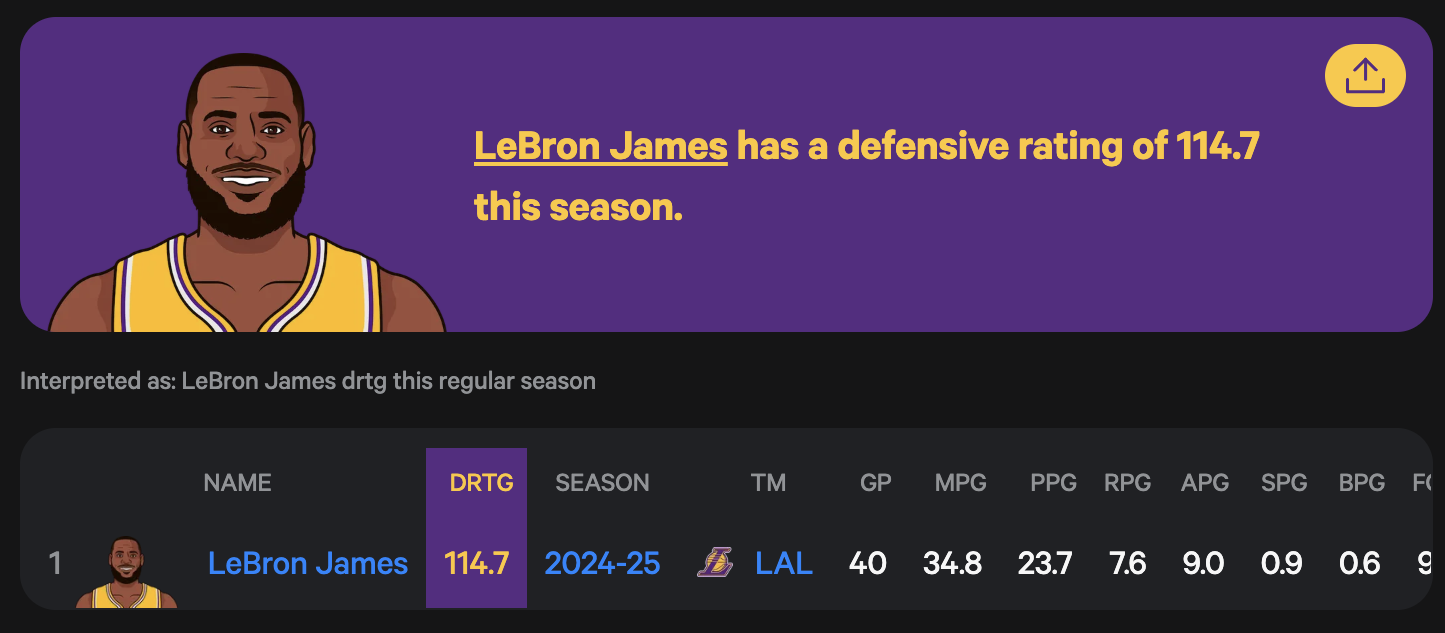
Examining Defensive Rating (DRTG):
So first, a DRTG measures the number of points a player allows per 100 possessions. A higher DRTG indicates weaker defensive performance, while a lower DRTG suggests stronger defense. When you compare the player’s DRTG to team averages and league benchmarks it helps to understand an individual player’s exact role. So such as breakdowns like home vs. away games, matchups against top-tier opponents, or performance by quarter can help to understand not just basic defense skills but how players play scenerio by scnerio. A deeper underrstanding of their though process.
Examining Plus/Minus:
So looking at Plus/Minus shows the net point differencel when a player is on the court versus off. A negative value indicates the team performs worse defensively when the player is active. A consistently negative defensive plus/minus values suggest the player struggles to positively influence defensive outcomes. When looking for these metrics it is quiet easy to simply gain access to this online but it is about comparing across multiple games to find a pattern.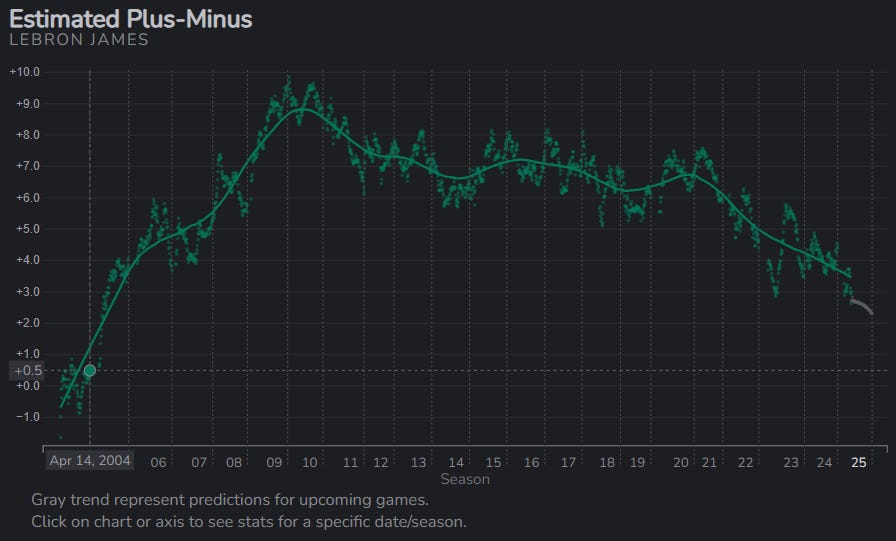
Examining Blocks Per Game:
A high BPG often shows a direct key data metric of how well a defensive player is doing his job. When it comes to analyzing of course if the value is high, this is a clear indicator that the defensive player is blocking and defending the ball at a good rate. In order to find these stats it is always important to find visual number chart and layouts, especially in combination with the plus/minus, this gives more insight on how well defensive mechanisms within a player actually is. You can also compare BPG to league averages and players in similar positions. For example, if a center’s BPG is below average, assess whether it’s due to poor timing, positioning, or lack of aggressiveness.
Lets Walk this Through...
So using these insights we are able to create a sample analysis with Lebron James and his performance in The Lakers. LeBron's blocks per game highlight his ability to protect the rim, often reflecting his defensive instincts and versatility. For example, if he averages 0.6 blocks per game, it shows he can disrupt shots effectively. Next, looking at his his DRTG, a DRTG of 105 would indicate solid defensive performance, especially when compared to league averages or his teammates' DRTG, but currently his rate seems to be on the negative lower side so this is a metric that would lean towards his abilities sliping. This metric, paired with his blocks, finally you can analyze his plus/minus, which measures the team's point differential while he’s on the court. For example, a +7 plus/minus would demonstrate that the team performs significantly better with him in the game. Visualizing this data such as plotting DRTG against plus/minus can highlight how LeBron's defensive skills and his impact beyond traditional scoring stats.